The Erie Canal, which runs just a mile or so from our home, has a long and colorful history.
For some time I’ve wondered if it might be possible to use 3D imaging software to recreate specific scenes along the canal at different moments in time. As a proof of concept I decided to work on a simple example: The Washington Street lift bridge in Adams Basin, shortly after the bridge was constructed in 1914.
Simple, because the terrain is flat and, at the time, Adams Basin was (or so I thought) a sleepy rural hamlet. A canal, a bridge, a road. Maybe a boat or two.
A bit of cursory research demolished that notion pretty quickly. As it turns out, Adams Basin was a much more interesting place a hundred years ago than it is today. It was a thriving community with its own canal terminal, post office, school, railroad station, and trolley station. (Yes, trolley. More on that later.) Retail and wholesale businesses – now long gone – lined the roads and canal. It had a lively political scene, too, with a dedicated group of civic-minded activists who, among other things, successfully lobbied the state for the construction of the lift bridge.
So there is much to do. The project has been underway now for several weeks (months), and as yet there is no end in site. But the research has been fascinating, and I’ve met some interesting people and have been able to hone my 3D visualization skills along the way.
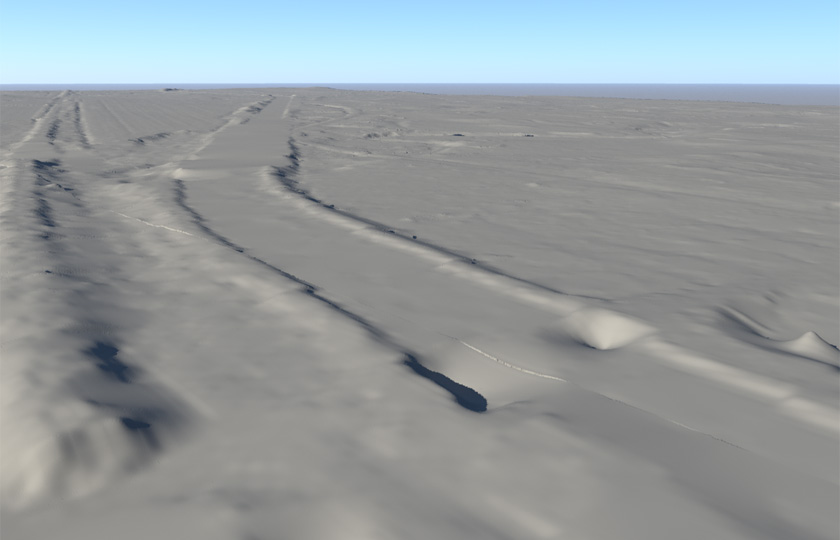
The first problem: How to set up the underlying terrain for a 4-square-mile area around the bridge. New York state provides high-resolution digital elevation data for free. But a quick rendering of that data (above) revealed that it is pretty rough, full of gaps and artifacts. Cleaning this up would take a lot more effort than it would be worth.
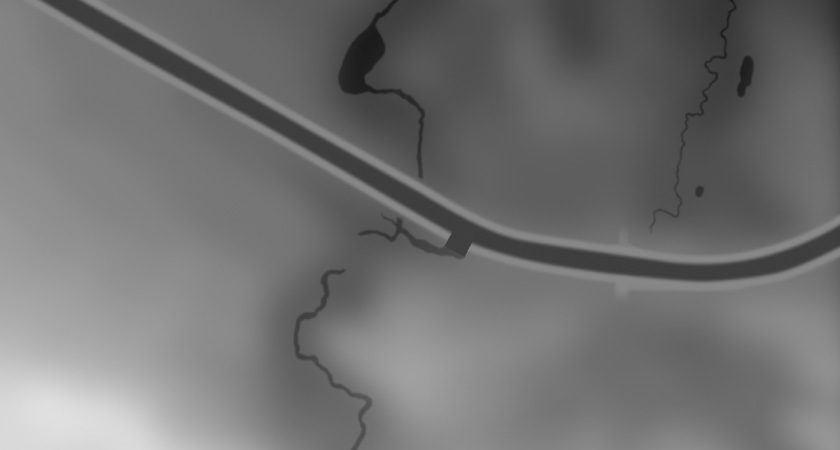
The solution was to create a displacement map by hand. Using aerial photos as a guide, the canal, streams, and railroad embankments were carefully painted in Photoshop, working in 32-bit mode for the widest range of grayscale values. Dark values are depressions. Lighter values are higher elevations.
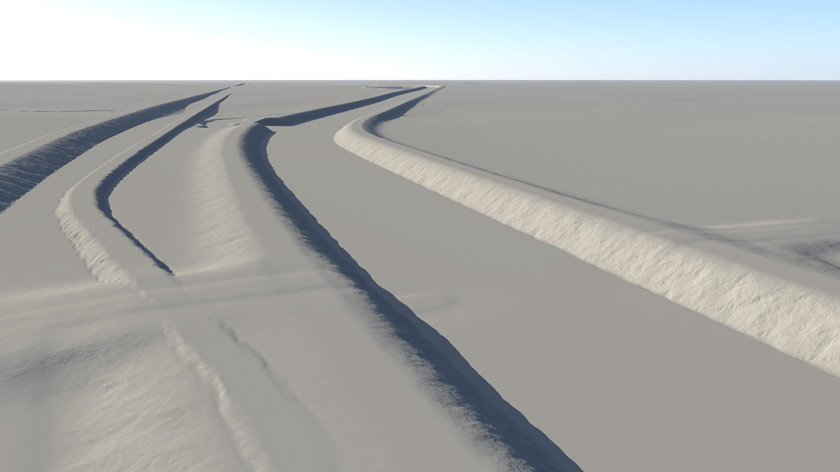
An oblique rendering of the displacement map in Terragen reveals a landscape that’s not much to look at, but it will work. The main feature is the canal bed, of course. But it also includes a north-south roadbed (north is to the right) and two long railroad embankments.
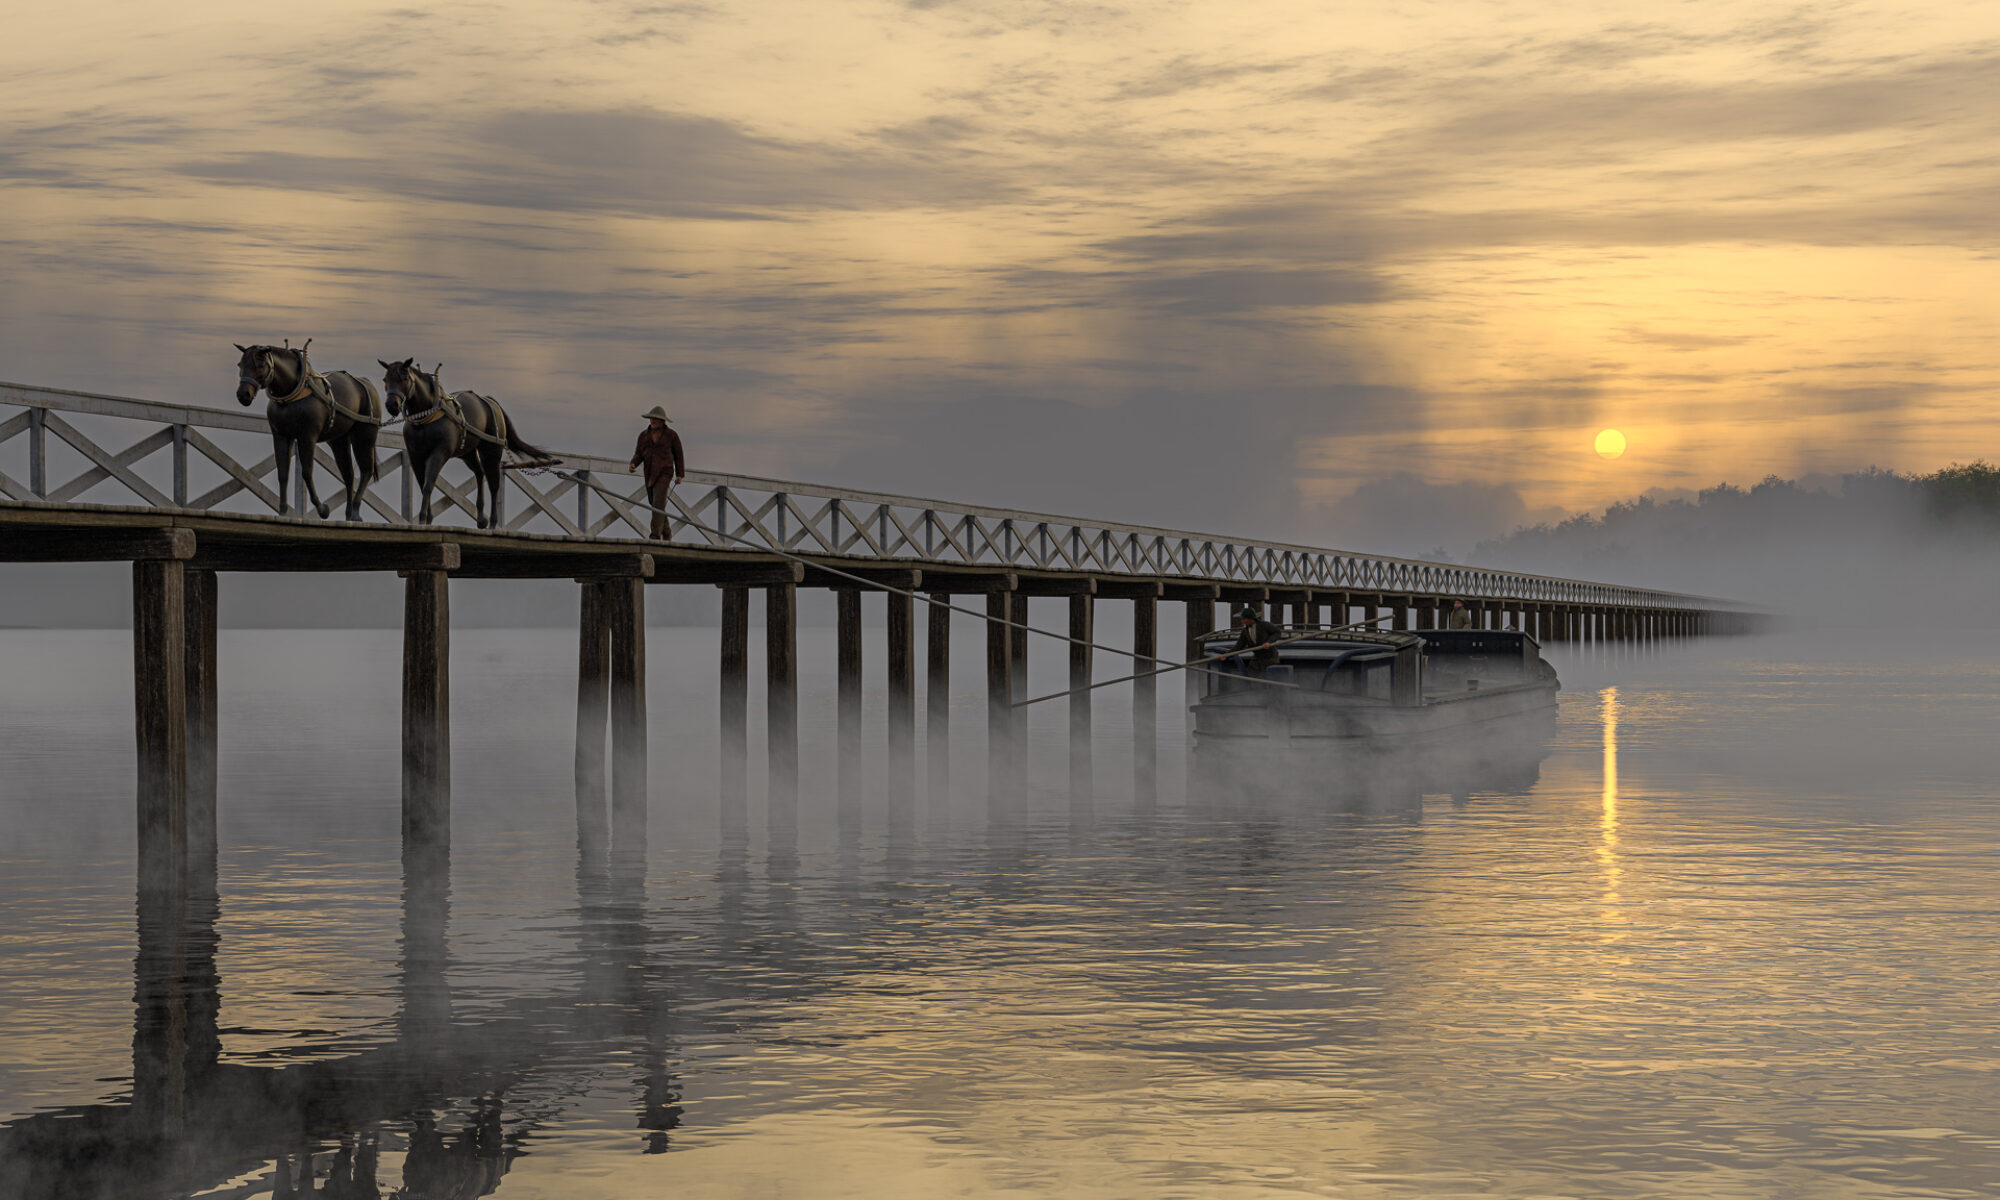
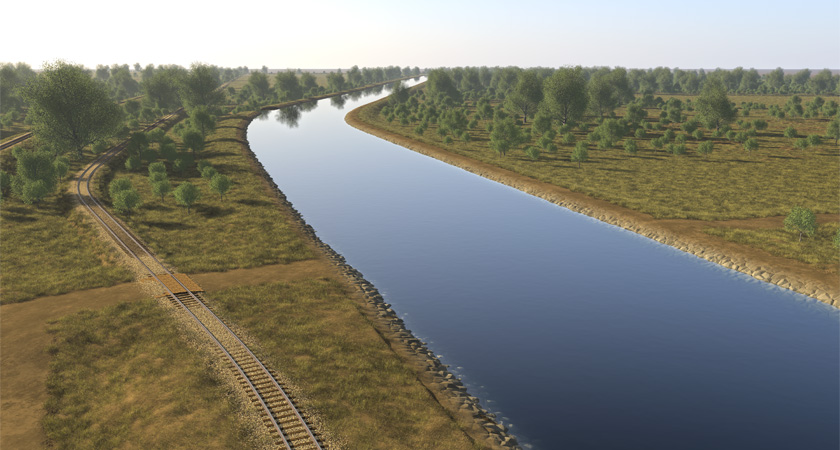
Grass and a temporary population of trees are added, a water surface is placed in the canal, and railways are placed to create the view shown at the top of this post.